For years a vulnerability report was special: scarce insight, offered confidentially, owed a response. Now that anyone’s LLM can find the same bugs, the report isn’t the scarce thing — the triage is. And the moment volume outruns the base rate, triage stops being a queue of obligations and becomes a screening test, with all the cruel arithmetic that implies.
Author
Matthew Gibbons
Published
25 June 2026
There’s a line every open-source maintainer learns to repeat to stay sane: every issue, every pull request, every bit of feedback is a gift, not an obligation. You can take it or leave it. Filippo Valsorda, who led the Go security team for years, wrote this week about the one exception he always carved out. Vulnerability reports were different. Those you owed something — a quick acknowledgement, an investigation, eventual credit — because the reporter was handing you something genuinely scarce: the insight to find the bug, and the confidentiality to fix it before anyone shipped an exploit. The researcher wasn’t asking you for a service. They were doing you one.
And then, in the same post, he takes it back. It’s 2026, the premises have quietly expired, and vulnerability reports aren’t special anymore. An LLM is now about as good as most security researchers at finding bugs, and anyone can run one — the maintainer, the researcher, the attacker. The insight isn’t scarce. “The bottleneck now,” he writes, “is not finding potential issues but assessing which ones are real.” A security@ inbox and the raw output of a model have, he says, “approximately the same signal-to-noise ratio.”
That phrase is the whole article hiding in plain sight. Once you say signal-to-noise ratio about your inbox, you’ve stopped describing a queue and started describing a screening test — and a screening test has arithmetic that an engineer’s instincts get badly, confidently wrong.
A report used to be a fact; now it’s a positive
Here’s the instinct I want to temper, because it’s the engineer’s and it served beautifully right up until it stopped. A vulnerability report arrives and you treat it as a discrete object with a truth value. Is the bug there or not? You read it, you reproduce it, you confirm or you close. Each report earns its own attention, gets handled on its own merits, and the work scales with the count. Fifty reports is fifty investigations. That’s a queue, and a queue is something an engineer knows how to drain.
But that model only holds while the reports are scarce and mostly real. What Filippo is describing is the regime where neither is true: the volume explodes, and the share of reports that are both real and worth acting on right now collapses. In that world each report isn’t a fact you verify, it’s a positive coming off a noisy detector. The reporter’s LLM flagged something. The question is no longer “is there a bug” — there usually is some defect — but “given that this looks real, what’s the chance it actually matters?” And that is not a property of the report. It’s a property of the whole stream the report came from.
The data scientist has a name for the thing you actually care about here. It’s the positive predictive value: of all the reports that trip the alarm, what fraction are the real, urgent ones. And the cruelty of screening is that the PPV depends far less on how sharp your detector is than on how rare the thing you’re hunting has become.
The base rate is what moved
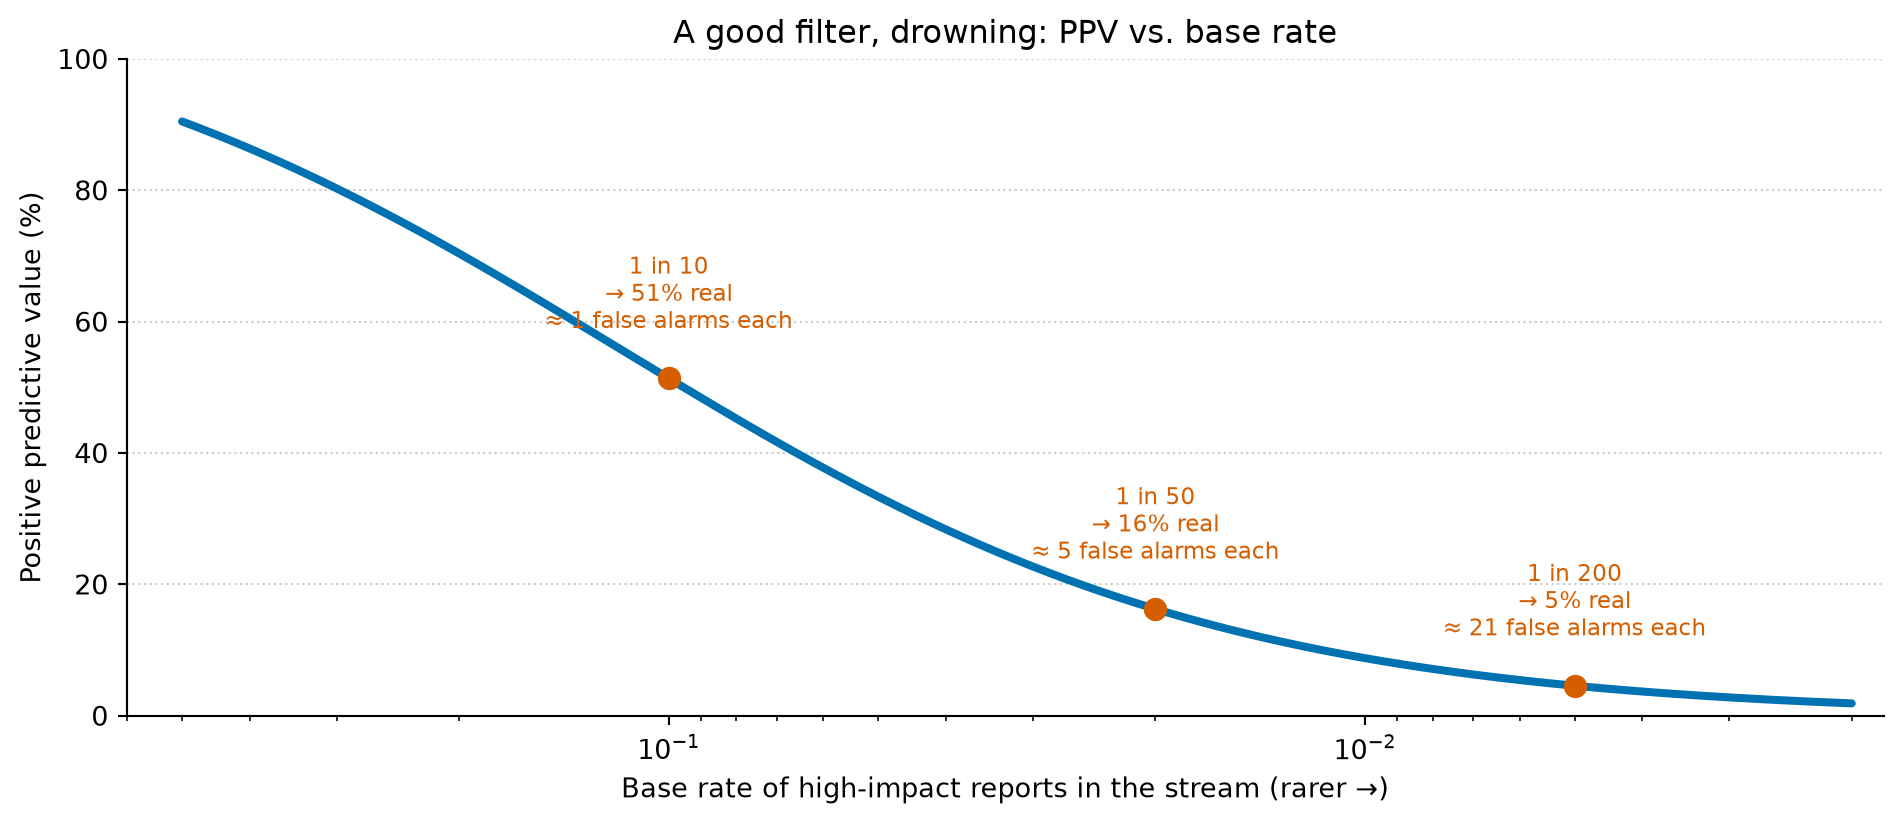
Suppose your triage is good. Say you — or your CI filter, or your own model — correctly flag 95% of the genuinely high-impact reports, and correctly wave through 90% of the noise. Those are numbers most classifiers would be proud of. Now watch what happens to the only number that governs your afternoon, the positive predictive value, as the base rate of high-impact reports falls.
Show the code behind this figure
import numpy as npimport matplotlib.pyplot as pltsensitivity =0.95# P(flagged | genuinely high-impact)specificity =0.90# P(not flagged | not high-impact)# Base rate of high-impact reports in the incoming stream.base_rate = np.logspace(np.log10(0.5), np.log10(0.002), 400)ppv = (sensitivity * base_rate) / ( sensitivity * base_rate + (1- specificity) * (1- base_rate))fig, ax = plt.subplots(figsize=(10, 4.4))fig.patch.set_alpha(0)ax.patch.set_alpha(0)ax.plot(base_rate, ppv *100, color='#0072B2', linewidth=3, solid_capstyle='round')# A few landmarks: false alarms read per genuine find = (1 - ppv) / ppv.landmarks = [(0.1, '1 in 10'), (0.02, '1 in 50'), (0.005, '1 in 200')]for br, label in landmarks: p = (sensitivity * br) / (sensitivity * br + (1- specificity) * (1- br)) fp_per_tp = (1- p) / p ax.scatter([br], [p *100], color='#D55E00', s=60, zorder=5) ax.annotate(f'{label}\n→ {p*100:.0f}% real\n≈ {fp_per_tp:.0f} false alarms each', xy=(br, p *100), xytext=(0, 16), textcoords='offset points', ha='center', va='bottom', color='#D55E00', fontsize=8.5)ax.set_xscale('log')ax.set_xlim(0.6, 0.0018) # reversed: common on the left, rare on the rightax.set_ylim(0, 100)ax.set_xlabel('Base rate of high-impact reports in the stream (rarer →)')ax.set_ylabel('Positive predictive value (%)')ax.set_title('A good filter, drowning: PPV vs. base rate')ax.spines['top'].set_visible(False)ax.spines['right'].set_visible(False)ax.yaxis.grid(True, linestyle=':', alpha=0.4, color='grey')ax.set_axisbelow(True)plt.tight_layout()plt.show()
Figure 1: A genuinely good triage filter — 95% sensitive, 90% specific — applied to a stream of reports. As the base rate of high-impact reports falls (left to right), the positive predictive value collapses: the fraction of flagged reports that actually matter drops from ~90% when half are real to under 5% when only 1 in 200 is. The detector never got worse. The stream did. The right-hand axis reads the same fact as a workload: false alarms you must read per genuine find.
When half the stream is real, your sharp triage gives you a 90% hit rate and life is fine. When one report in fifty is the urgent kind, that same triage — unchanged, still 95% sensitive — is right only about one time in six. When it’s one in two hundred, you read roughly twenty false alarms for every genuine find. Nothing about your judgement degraded. The base rate moved, and the base rate was always the thing in charge.
This is the exact arithmetic that makes mass medical screening hard. A test that’s 99% accurate for a disease that afflicts one person in a thousand still returns mostly false positives, because the rare truth is swamped by the common error. Doctors have known this for a century; it’s why you don’t screen the whole population for a rare cancer even with a good test. Filippo’s inbox just joined the screening clinic. The LLMs didn’t make the reports worse — many are perfectly “real” in the narrow sense of pointing at a genuine defect. They made the valuable ones rare relative to the flood, and rarity is what poisons a positive.
“Special” was a threshold all along
Read the discussion under Filippo’s post and you can watch a roomful of security engineers rediscover statistics from first principles, without quite reaching for the words. One says the next job is “getting good at classifying reports rapidly into special and not-special buckets.” Another says the truly special reports — the very high severity, the ones from trusted sources — should still be treated as special, and it’s on the defender to “meet a new, higher bar.” A third notes that because the bad reports are now cheap and shallow, you can finally just ban the worst submitters and wait for a better-orchestrated model to send the same bug.
Every one of those is a move on the same diagram. “Special versus not-special” is a decision threshold, and choosing it is choosing where to sit on the trade-off between missing a real one and drowning in false ones — the operating point on a curve the data scientist would draw without thinking. “From trusted sources” is a prior: a known good reporter has a higher base rate of real findings, so the same report from them earns a higher posterior and clears the bar that an anonymous one doesn’t. And “ban the slop merchants” is just lifting the population’s base rate by filtering the stream upstream, which — as the figure shows — does more for your PPV than any amount of squinting harder at individual reports. The vocabulary the security team is missing isn’t security vocabulary. It’s the screening test, the base rate, the prior, the operating point.
What the engineer should actually take from this
The reflex, on realising the queue is now a screen, is to demand a better detector. Run the LLM analysis in CI, sharpen the filter, raise the sensitivity. It’s the right instinct and it is not enough, because sensitivity was never the binding constraint — the figure barely moves if you nudge it. What moves the figure is the base rate, and you change a base rate by changing the population: cultivate trusted reporters, gate the firehose, refuse the anonymous slop, route the high-severity and high-trust reports down a different path from the everything-else. You are not draining a queue anymore. You are running a clinic, and the first job in a clinic is to decide who gets the expensive test.
There’s a quieter lesson too, the one that travels well past security. Any time a stream of cheap “positives” starts arriving faster than you can verify them — bug reports, fraud alerts, content flags, model outputs marked for review — the work silently changes shape. It stops being a list of things to check and becomes a screening problem governed by a base rate you probably haven’t measured. The engineer keeps asking “is this one real?” and grinding through the list. The data scientist asks the question that actually scales: out of everything that trips this alarm, what fraction is worth my time — and is that fraction going up or down? On the evidence of this week, in more than one inbox, it’s going down.
Part of an occasional series reframing everyday engineering through a data scientist’s eyes. The ideas here are developed properly in Thinking in Uncertainty and Building with Certainty.