Quarantining a flaky test assumes its true pass rate is 100%. It isn’t — a test that touches anything real is a Bernoulli trial, and nineteen green runs prove far less than you’d think.
Author
Matthew Gibbons
Published
17 April 2026
The CI run goes red. Someone re-runs it, it goes green, and a message lands in the channel: “flaky test, ignore — I’ve kicked off a retry.” A few days later the same test does it again, and this time it earns a @retry decorator or a quiet @pytest.mark.flaky, and everyone moves on. Nobody is happy about it, but nobody has time for it either. I’ve sent that message myself.
“Flaky” is doing a lot of work in that sentence. It sounds like a description, but it’s really a diagnosis, and it smuggles in an assumption: that the test ought to pass every time, and the failures are noise to be suppressed. That assumption is worth examining, because for a large class of tests it’s simply false.
Any test that touches a clock, a socket, a thread schedule, or an unseeded random number generator is not deterministic. Run it and it passes or it fails, and which one you get is a draw from a distribution. That’s a Bernoulli trial — the most basic probabilistic object there is. And the moment you’re looking at a Bernoulli trial, you no longer have a bug to fix. You have a parameter to estimate: the true failure rate. The question quietly changes from “is it broken?” to “what’s the failure rate, and how sure am I?”
Nineteen greens prove less than you think
Here’s the number that should unsettle you. A test that has passed nineteen times out of twenty has not demonstrated that it’s reliable. It has barely demonstrated anything at all.
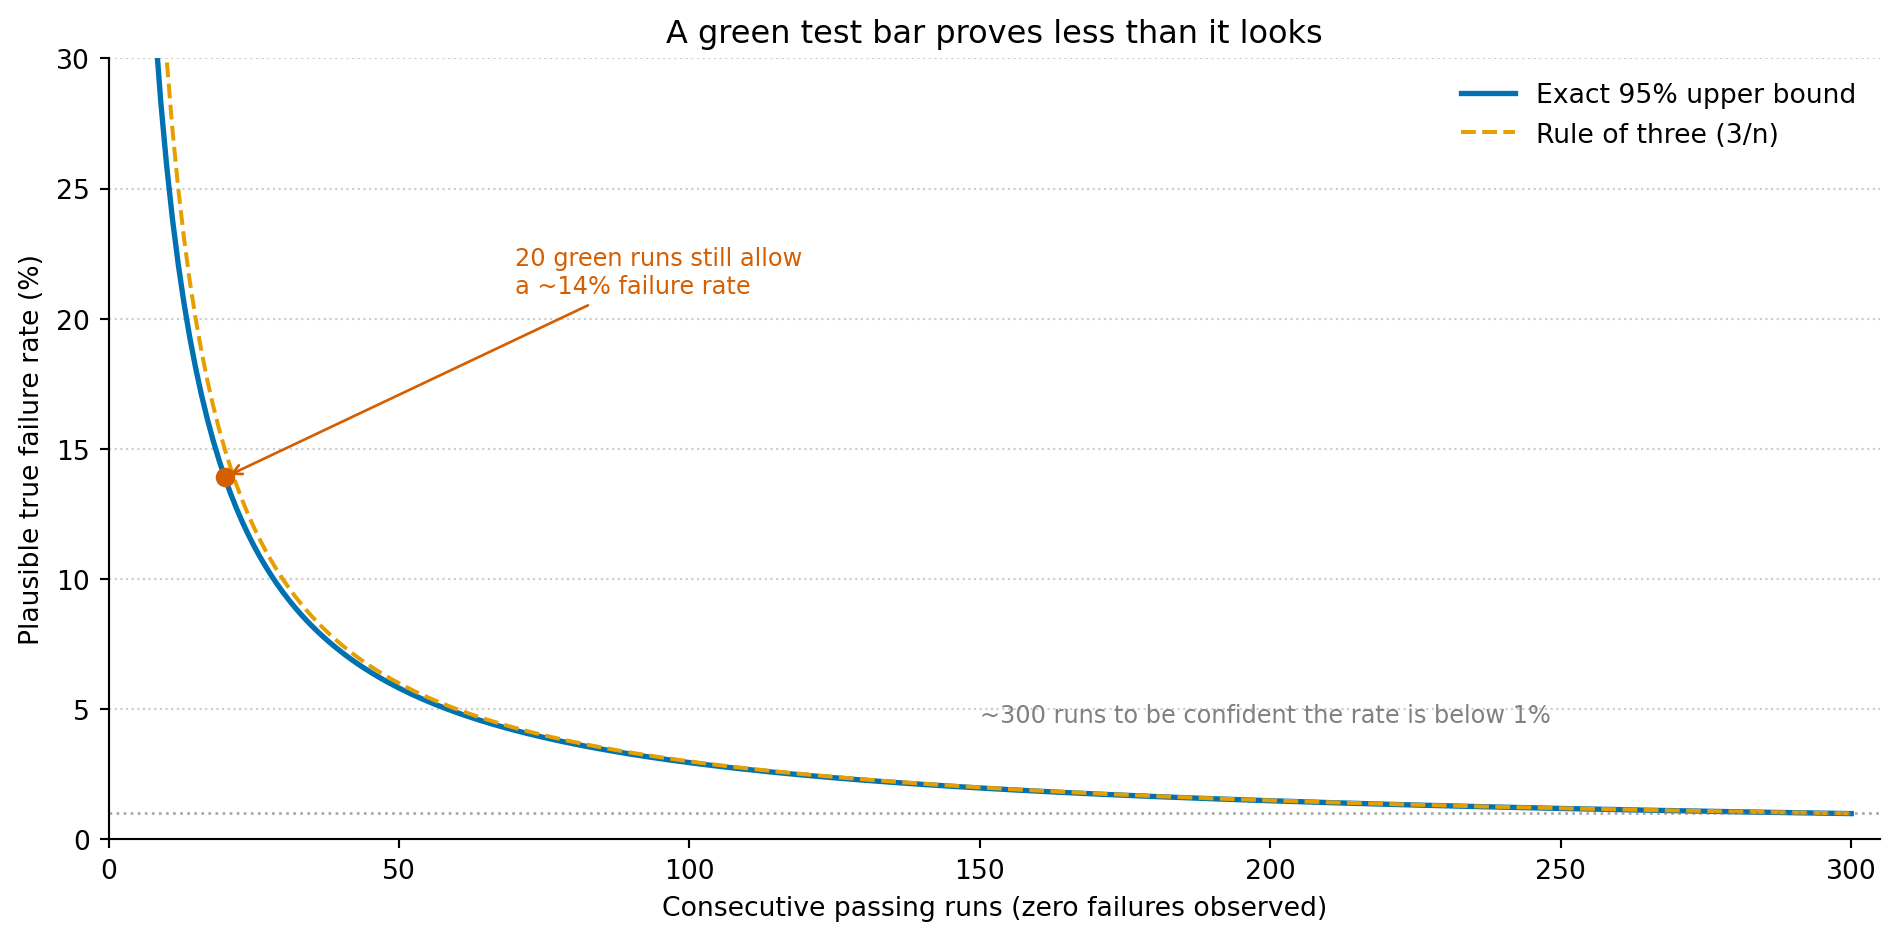
If you’ve observed zero failures in n runs, the most you can say is that the true failure rate is probably below roughly 3/n — the “rule of three,” and a decent approximation to the exact statistical bound. At twenty runs, that ceiling is around 14%. To push it below 1% — to be 95% confident the test fails less than one CI run in a hundred — you need close to three hundred consecutive green runs. Most “fixed” flaky tests have been watched a handful of times and waved through.
Show the code behind this figure
import numpy as npimport matplotlib.pyplot as plt# Exact one-sided 95% upper bound on the true failure rate after observing# zero failures in n runs: 1 - 0.05 ** (1/n). The rule of three (3/n) is the# familiar back-of-the-envelope approximation.n = np.arange(1, 301)exact = (1-0.05** (1/ n)) *100approx =3/ n *100fig, ax = plt.subplots(figsize=(10, 5))fig.patch.set_alpha(0)ax.patch.set_alpha(0)ax.plot(n, exact, color='#0072B2', linewidth=2, label='Exact 95% upper bound')ax.plot(n, approx, color='#E69F00', linewidth=1.5, linestyle='--', label='Rule of three (3/n)')# The case that started the Slack thread: twenty clean runs.bound_20 = (1-0.05** (1/20)) *100ax.scatter([20], [bound_20], color='#D55E00', s=40, zorder=4)ax.annotate('20 green runs still allow\na ~14% failure rate', xy=(20, bound_20), xytext=(70, 21), color='#D55E00', fontsize=9, arrowprops=dict(arrowstyle='->', color='#D55E00'))# The 1% line, and what it costs to get under it.ax.axhline(1, color='grey', linewidth=1, linestyle=':', alpha=0.7)ax.annotate('~300 runs to be confident the rate is below 1%', xy=(300, 1), xytext=(150, 4.5), color='grey', fontsize=9)ax.set_xlabel('Consecutive passing runs (zero failures observed)')ax.set_ylabel('Plausible true failure rate (%)')ax.set_title('A green test bar proves less than it looks')ax.set_xlim(0, 305)ax.set_ylim(0, 30)ax.spines['top'].set_visible(False)ax.spines['right'].set_visible(False)ax.yaxis.grid(True, linestyle=':', alpha=0.4, color='grey')ax.set_axisbelow(True)ax.legend(loc='upper right', framealpha=0.0)plt.tight_layout()plt.show()
Figure 1: After seeing only green, the most you can say is that the true failure rate is probably below the blue line. Twenty clean runs still leave room for a one-in-seven failure rate. Certainty below 1% costs hundreds of runs — and that’s the cost of the evidence a single green tick quietly implies.
The case that actually triggered the message — one failure in twenty — is worse still. The 95% confidence interval on its true failure rate runs from about a tenth of a percent all the way to nearly a quarter. You genuinely cannot tell, from twenty runs, whether this test fails once in a thousand times or once in five. That isn’t a shortcoming of your tooling. It’s the irreducible width of an estimate built on twenty data points, and no amount of staring at the stack trace will narrow it. Only more runs will.
The retry decorator spends a budget you can’t see
A retry turns the bar green, but it doesn’t touch the failure rate. It resamples until it gets the answer it wanted. If the system under test genuinely fails one call in fifty, three automatic retries hide that almost perfectly inside CI — and do precisely nothing for the user in production, who doesn’t get a retry.
You already know this shape of reasoning; you just apply it elsewhere. It’s an error budget. An SLO doesn’t promise zero failures, it budgets for a small rate of them and asks you to spend that budget deliberately. A retry decorator on a flaky test spends the same kind of budget, except silently and without measuring it, while moving the evidence out of view. The failures are still happening. You’ve just stopped counting them — and a team-wide retry policy turns that into a standing decision not to look.
When green stops meaning go
Step back and the reason this stings comes into focus. The whole value of a test is that it’s an oracle: a crisp, deterministic verdict you can hang a deploy on. Red means stop, green means go. A flaky test is the process quietly telling you that the oracle has gone probabilistic — that somewhere between the assertion and the world, a coin is being flipped.
The first time one of these landed on me, I did the natural thing: treated the wobble as a defect and went hunting for the bug that would make it deterministic again. Sometimes there was one. Often there wasn’t — the thing I was calling flaky was a faithful report of a system that genuinely behaves differently from one run to the next, and the only bug was my assumption that it shouldn’t. The reflex that says same input, same output, the one that makes assert f(x) == expected feel like solid ground, had quietly stopped being true, and it took me longer than I’d like to admit to stop fighting it. The move that actually helps runs against the instinct: don’t stamp the variation out, measure it. It’s the same shift that turns error from a bug into information.
What to actually do with a flake
None of this means you should shrug at flaky tests. It means you should locate the randomness before you decide what it is.
If the randomness lives in the test — an unseeded generator, a hard-coded sleep, an assumption about dictionary ordering or wall-clock time — then the test is wrong, and the fix is to make it deterministic. It had no business being a Bernoulli trial in the first place. Seed the generator, inject the clock, await the condition instead of sleeping past it. You’re not estimating a rate here; you’re removing the coin.
But if the randomness lives in the system under test — a race, an eventual-consistency window, a timeout that’s genuinely too tight — then the flake is a real measurement of how that system behaves, and silencing it throws away the one signal that was trying to reach you. The right move is to estimate the rate before you judge it. Run it a few hundred times and count. A test that fails one time in three is a production incident waiting to happen; one that fails one time in three thousand might be an acceptable cost you choose to budget for. Twenty runs cannot tell those two apart, and the retry decorator papers over both.
Once you see CI as a sampling process rather than a verdict machine, the vocabulary shifts under your feet. “Flaky” stops being an insult you throw at a test and becomes a measurement you haven’t finished taking. The engineer asks whether it’s broken. The data scientist asks how many runs it would take before they’d believe the answer either way — which, it turns out, is the more useful question in both jobs.
Part of an occasional series reframing everyday engineering through a data scientist’s eyes. The ideas here are developed properly in Thinking in Uncertainty and Building with Certainty.